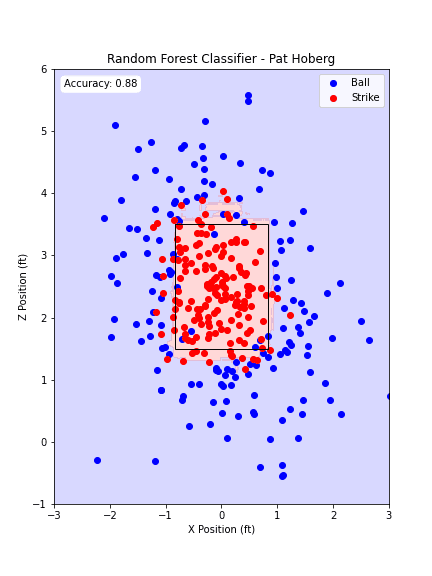
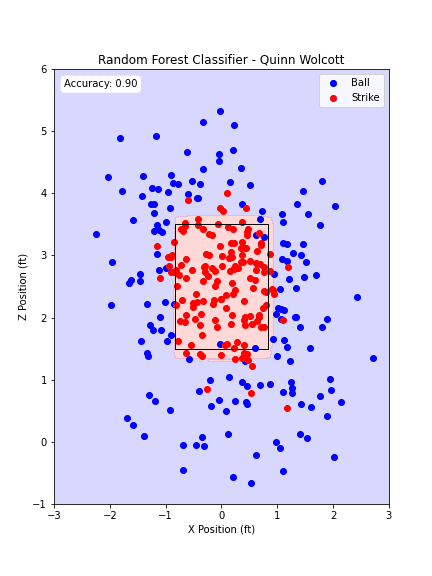
Pitch tracking is good enough now that people keep proposing robot umpires, and players keep pushing back that it would remove the “human element” of the game. For our MEEN 423 machine learning final project at Texas A&M in Fall 2023, my three-person team flipped the usual question. Instead of asking whether a call was correct, we asked whether a model could learn how one specific umpire calls the zone, quirks included.
We picked six MLB home plate umpires (Angel Hernandez, Erich Bacchus, Junior Valentine, Malachi Moore, Pat Hoberg and Quinn Wolcott) and trained a separate classifier for each one. The target is not the rulebook zone. It is that umpire’s zone.
The Data
We pulled every called pitch (no swing) from 170 games of the 2023 regular season on Baseball Savant: 35,508 pitches in total, roughly balanced between balls and strikes.
| Umpire | Games | Called pitches |
|---|---|---|
| Angel Hernandez | 13 | 2,769 |
| Erich Bacchus | 32 | 6,561 |
| Junior Valentine | 35 | 7,092 |
| Malachi Moore | 31 | 6,603 |
| Pat Hoberg | 29 | 6,417 |
| Quinn Wolcott | 30 | 6,066 |
Each row carries the pitch location as it crosses the plate (pX, pZ), the call, the batter’s strike zone top and bottom (sZ_top, sZ_bot) and the home plate umpire.
Normalizing the Zone
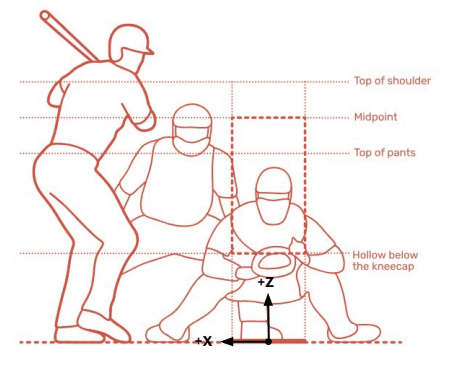
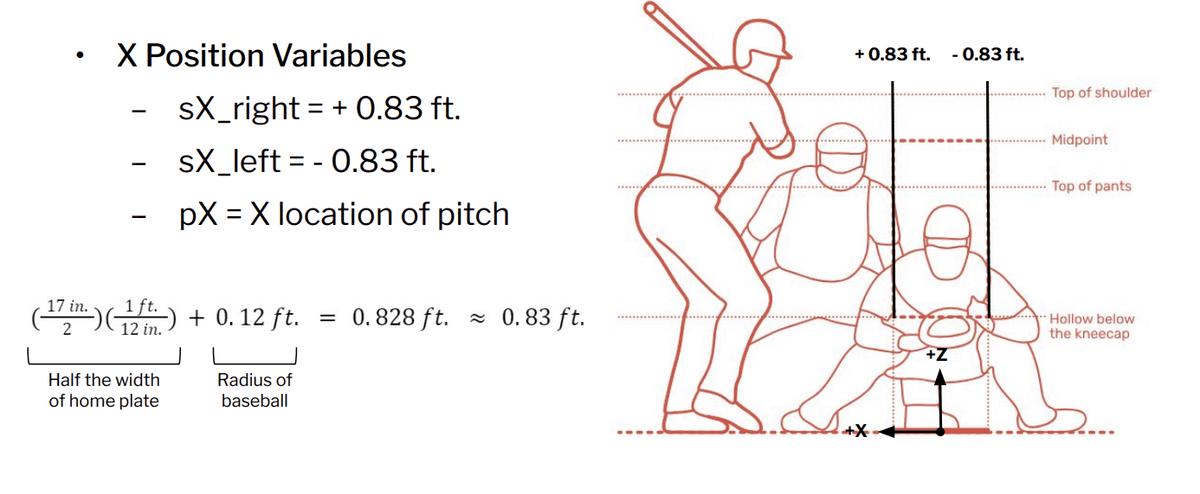
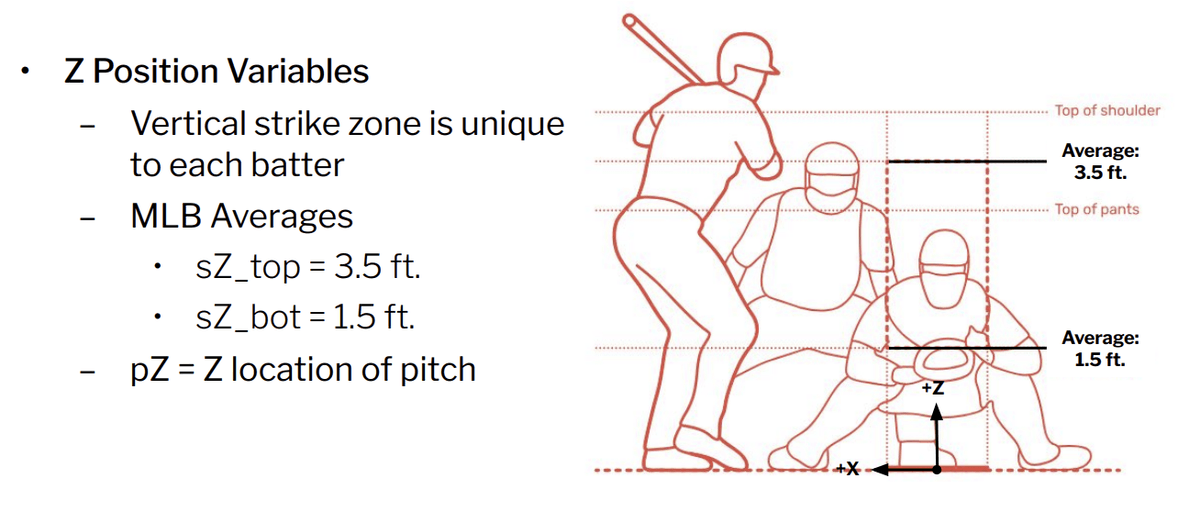
The horizontal zone is fixed for everyone: half the 17 inch plate plus the 0.12 ft radius of a ball, which puts the edges at ±0.83 ft. The vertical zone is not. It runs from the hollow below the batter’s kneecap to the midpoint between shoulders and belt, so a pitch at 3.2 ft is a strike against a tall hitter and a ball against a short one.
To compare pitches across batters, we rescaled every pZ into an average zone of 1.5 to 3.5 ft, the MLB averages for sZ_bot and sZ_top:
pZ_norm = (pZ - sZ_bot) / (sZ_top - sZ_bot) * (3.5 - 1.5) + 1.5
After that, every pitch for every batter lives in the same two-dimensional frame, and the only features each model sees are horizontal location and normalized height.
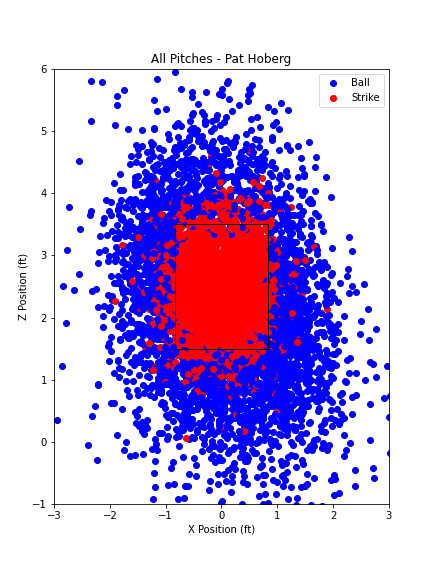
Plotting all of one umpire’s calls in that frame already shows the shape of their zone before any model is trained.
Three Models per Umpire
For each umpire we split the calls 95/5 into training and test sets and fit three scikit-learn classifiers:
- Support vector machine with an RBF kernel (
C=1.0,gamma='scale'). The strike zone is a rounded box, so a linear boundary is not enough. - Gradient boosting with 100 depth-3 trees at a learning rate of 0.1.
- Random forest with 200 trees,
max_depth=10andmin_samples_split=10.
For the random forest we also ran a 5-fold GridSearchCV over tree count, depth, split size and leaf size for each umpire. The best settings differed noticeably between umpires (Quinn Wolcott’s zone was fit best by 50 shallow depth-5 trees, Junior Valentine’s by depth-20 trees), which is a small hint that the zones themselves differ in how sharp their edges are.
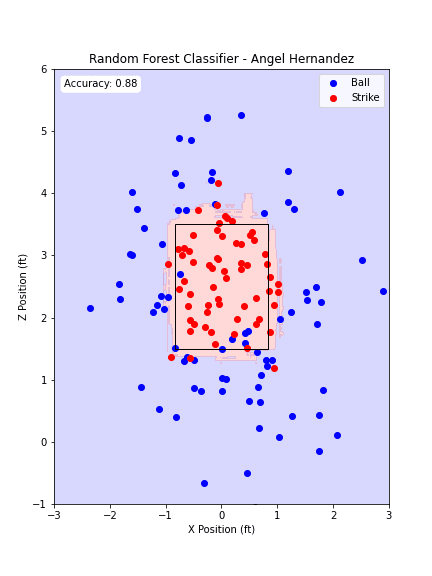
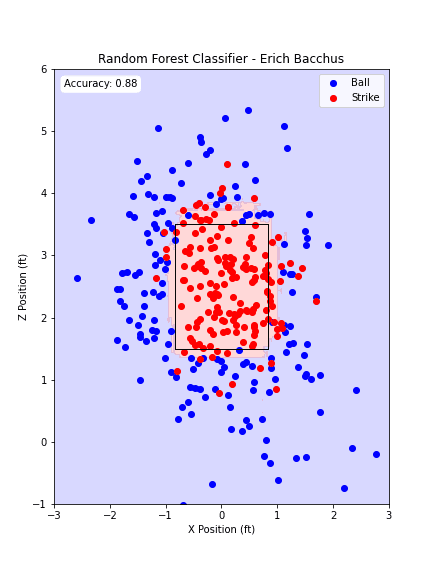
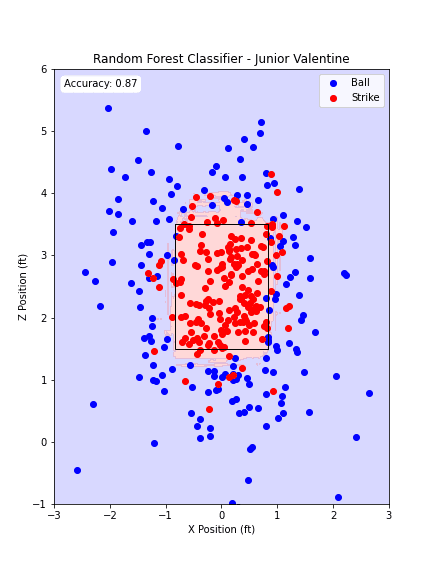
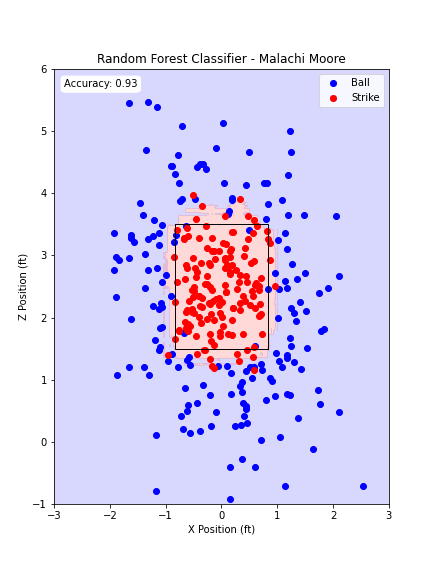
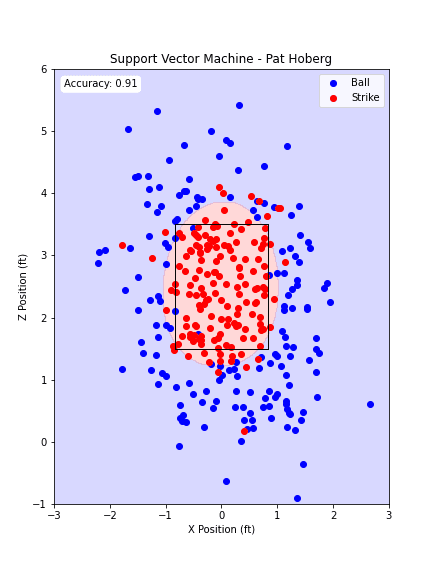
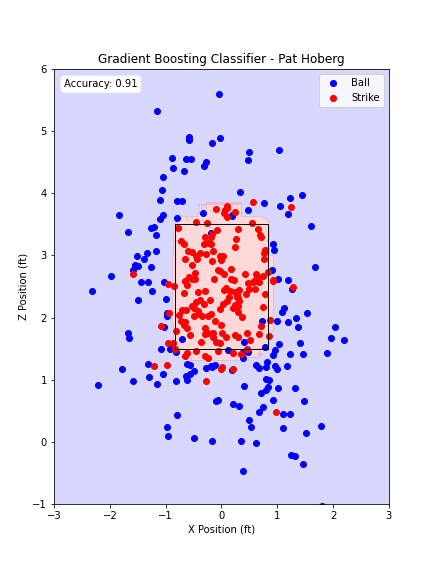
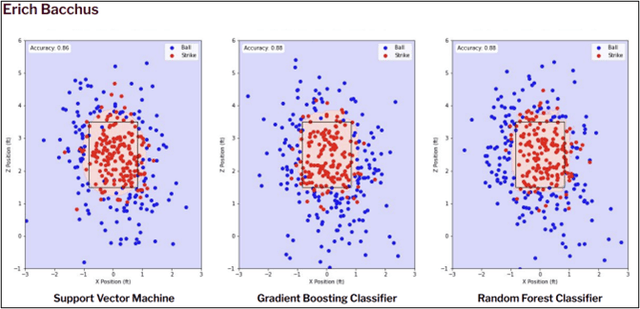
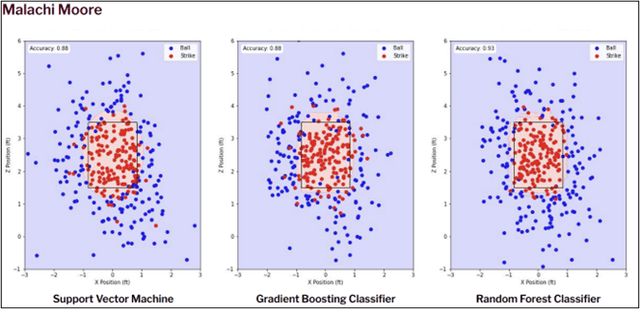
To see what each model learned, we evaluated it on a dense 500 by 500 grid over the plate area and drew the predicted ball and strike regions as a contour, with the held-out test pitches and the rulebook box on top. Misses show up immediately as red dots in blue territory or the reverse.
Results
Accuracy here means agreement with the umpire’s actual call on held-out pitches, not agreement with the rulebook.
| Umpire | SVM | Gradient boosting | Random forest |
|---|---|---|---|
| Angel Hernandez | 0.88 | 0.86 | 0.88 |
| Erich Bacchus | 0.86 | 0.88 | 0.88 |
| Junior Valentine | 0.90 | 0.87 | 0.87 |
| Malachi Moore | 0.88 | 0.88 | 0.93 |
| Pat Hoberg | 0.91 | 0.91 | 0.88 |
| Quinn Wolcott | 0.87 | 0.90 | 0.90 |
| Average | 0.884 | 0.883 | 0.890 |
All three model families landed between 0.883 and 0.890 on average, so with only two features the choice of classifier barely matters. The test set is only 5% of each umpire’s pitches (about 140 to 350 calls), so differences of a couple of points between cells are within noise, and I would not read much into which model “won” for a given umpire.
The more interesting output is the shape of the learned zones. They are rounded rather than square, they bleed past the rulebook box in places, and they are not the same from umpire to umpire.
What I Would Do Next
A per-umpire model opens up a few questions we only sketched in the report: replaying a contested call under a different umpire’s zone, simulating a whole game as if someone else were behind the plate, or checking whether an umpire’s zone drifts within a game. On the modeling side, the obvious next steps are adding count and batter handedness as features and evaluating with proper cross-validation instead of a single small test split.
The code, the dataset, the plots and the full report are in the GitHub repository.