People ask me when fish farms will be autonomous, and the question almost always assumes there is one thing to automate.
There is not, and there is not even one kind of farm. A recirculating system, an ocean net pen and a concrete flow-through raceway are three different machines with three different binding constraints. What they share is a shape. Water chemistry sits under oxygen, oxygen sits under feed, feed sits under growth, growth sits under grading and harvest, and every layer inherits the measurement error of the layers beneath it.
Read that the way you read an architecture diagram and the ordering problem becomes obvious.
You cannot optimize a layer you cannot measure.
Most of the literature below is about recirculating systems, because that is where the measurement literature lives. The farm I work in is the third kind, Idaho flow-through raceways, where the binding regulatory constraint is phosphorus.
Nobody Has Agreed What a Farm Should Measure
There is no regulatory standard for what a recirculating aquaculture system must measure, and no official guidance on acceptable ranges or fluctuation. Each farmer decides. That fact, from Lindholm-Lehto’s review in Aquaculture, Fish and Fisheries, is the clearest explanation I have found for why aquaculture data is fragmented.
The targets themselves are well established: dissolved oxygen 6-9 mg/L, un-ionized NH3-N under 0.0125-0.03 mg/L, CO2 under 15-20 mg/L. What matters for automation is that the list splits into three tiers: continuous for oxygen, CO2, pH and temperature; daily or manual for salinity and turbidity; lab-only for nitrogen species, off-flavors, metals and hormones. The review is blunt about that third tier: “Real-time measurements of more advanced parameters still require further development.”
The continuous tier is not free either. That review notes instrumentation “need[s] competent users and require[s] regular maintenance and calibration,” and lists “Computer vision unsuitable under high turbidity” among its limitations. I sell computer vision, and I keep that second sentence where I can see it. Our own passive stereo depth on a wet fish returned about 13% valid pixels, which is the same finding arriving from a different direction.
Now put the Idaho farms beside that. Roughly 115 permitted facilities operate in the state, nearly 70% in the Magic Valley, discharging to the Snake River or its tributaries. Their permits carry numeric limits for phosphorus and suspended solids, EPA and the state required the middle Snake farms to cut phosphorus loads by roughly 40%, and part of how the industry met that was reformulating feed to hold less phosphorus.
A water-quality regulator reached back into the feed mill. That is the whole stack, read from the wrong end, in one policy.
Oxygen Is the Tightest Loop in the Building
Without backup, the Global Seafood Alliance’s review of recirculating unit processes puts an oxygenation failure at “total loss of the fish crop in 30 minutes or less.” That deadline sets the architecture: aeration alone caps stocking density near 30-40 kg of fish per cubic meter, and going denser requires pure-oxygen contacting.
Easier to miss is that the oxygen budget is coupled to solids handling: as little as 0.3 kg of oxygen per kg of feed where solids leave quickly, up to 1.0 kg where they sit in submerged biofilters. A more than three-fold swing, decided by how fast waste leaves the water.
Solids management is not a cleanliness decision. It is an oxygen decision.
The Failures That Kill a Crop Start Upstream of the Biology
Hydrogen sulfide is the defining acute failure mode of marine and brackish recirculating systems. Seawater carries about a thousand times the sulfate of fresh water, the literature recommends exposure not exceed 5 micrograms per liter, and one documented event climbed from under 1 to 10 micrograms per liter, the initial rise happening “in a matter of seconds” and taking roughly 15 hours to aerate back out.
Real-time monitoring at those levels, per Frontiers in Marine Science, “has not been available and therefore not yet practiced for commercial purposes.” It would not close the loop anyway: formation is hard to predict, and frequent measurement is required but insufficient for prevention. It is the cleanest example in this industry of a sensor whose only job is to tell you that you have already lost.
The best-documented mass mortality event makes the same point from the other side. At Atlantic Sapphire’s Miami facility on 24 March 2021, roughly 500,000 Atlantic salmon averaging 1 kg died after significant amounts of particles passed from the drum filters into the biofilters, raising turbidity and triggering abnormal fish behavior. The company attributed it to an identified design weakness from its supplier, and a known fix had not yet been retrofitted.
Half a million fish, and the root cause was a filter.
Feed Is Scored by a Metric Its Best-Known Paper Dismantles
Feed conversion ratio is what everybody quotes, and the paper most often cited to flatter aquaculture is the one that takes the comparison apart. Fry and colleagues, in Environmental Research Letters in 2018, titled it “Feed conversion efficiency in aquaculture: do we measure it correctly?” They report FCRs of 1.0-2.4 for farmed fish and shrimp against chicken 1.7-2.0 and beef 6.0-10.0, then argue the metric is the wrong instrument, because it counts only the weight of feed going in, not its nutritional content, not the inedible portion of the animal.
On nutrient retention, the measure those authors endorse, aquaculture is comparable to or worse than chicken: 37% protein retention for chicken against 28% for Atlantic salmon. I have watched people in this industry, us included, reach for the FCR line because it flatters. Learn the honest version first. Somebody in the room already knows it.
Feed delivery itself is well instrumented. The denominator is the problem, because FCR needs biomass.
Biomass Is the Number Every Other Number Leans On
Conventional on-farm biomass estimation carries an inherent inaccuracy of 15-25% and stresses or damages the fish while producing it. The Global Seafood Alliance’s review of non-intrusive methods describes the obvious workaround (inferring biomass from cumulative feed and an assumed FCR) as possibly “not accurate enough.”
My reading of that, and it is a reading rather than a finding, is that the shortcut is only as good as the reconciliation behind it. The curve comes from the feed supplier or the breeding program, and the estimate is checked against counted biomass at grading and harvest. Between those checkpoints it drifts, and the metric you would use to catch the drift is built from the number that drifted.
The machine-vision alternatives degrade in exactly the conditions commercial farms operate in: fish overlap, poor light, turbidity, bubbles, and a single camera that “is not adequate to capture the entire area.” Adding feature variables raises accuracy while making models less robust: the failure mode nobody puts in a datasheet.
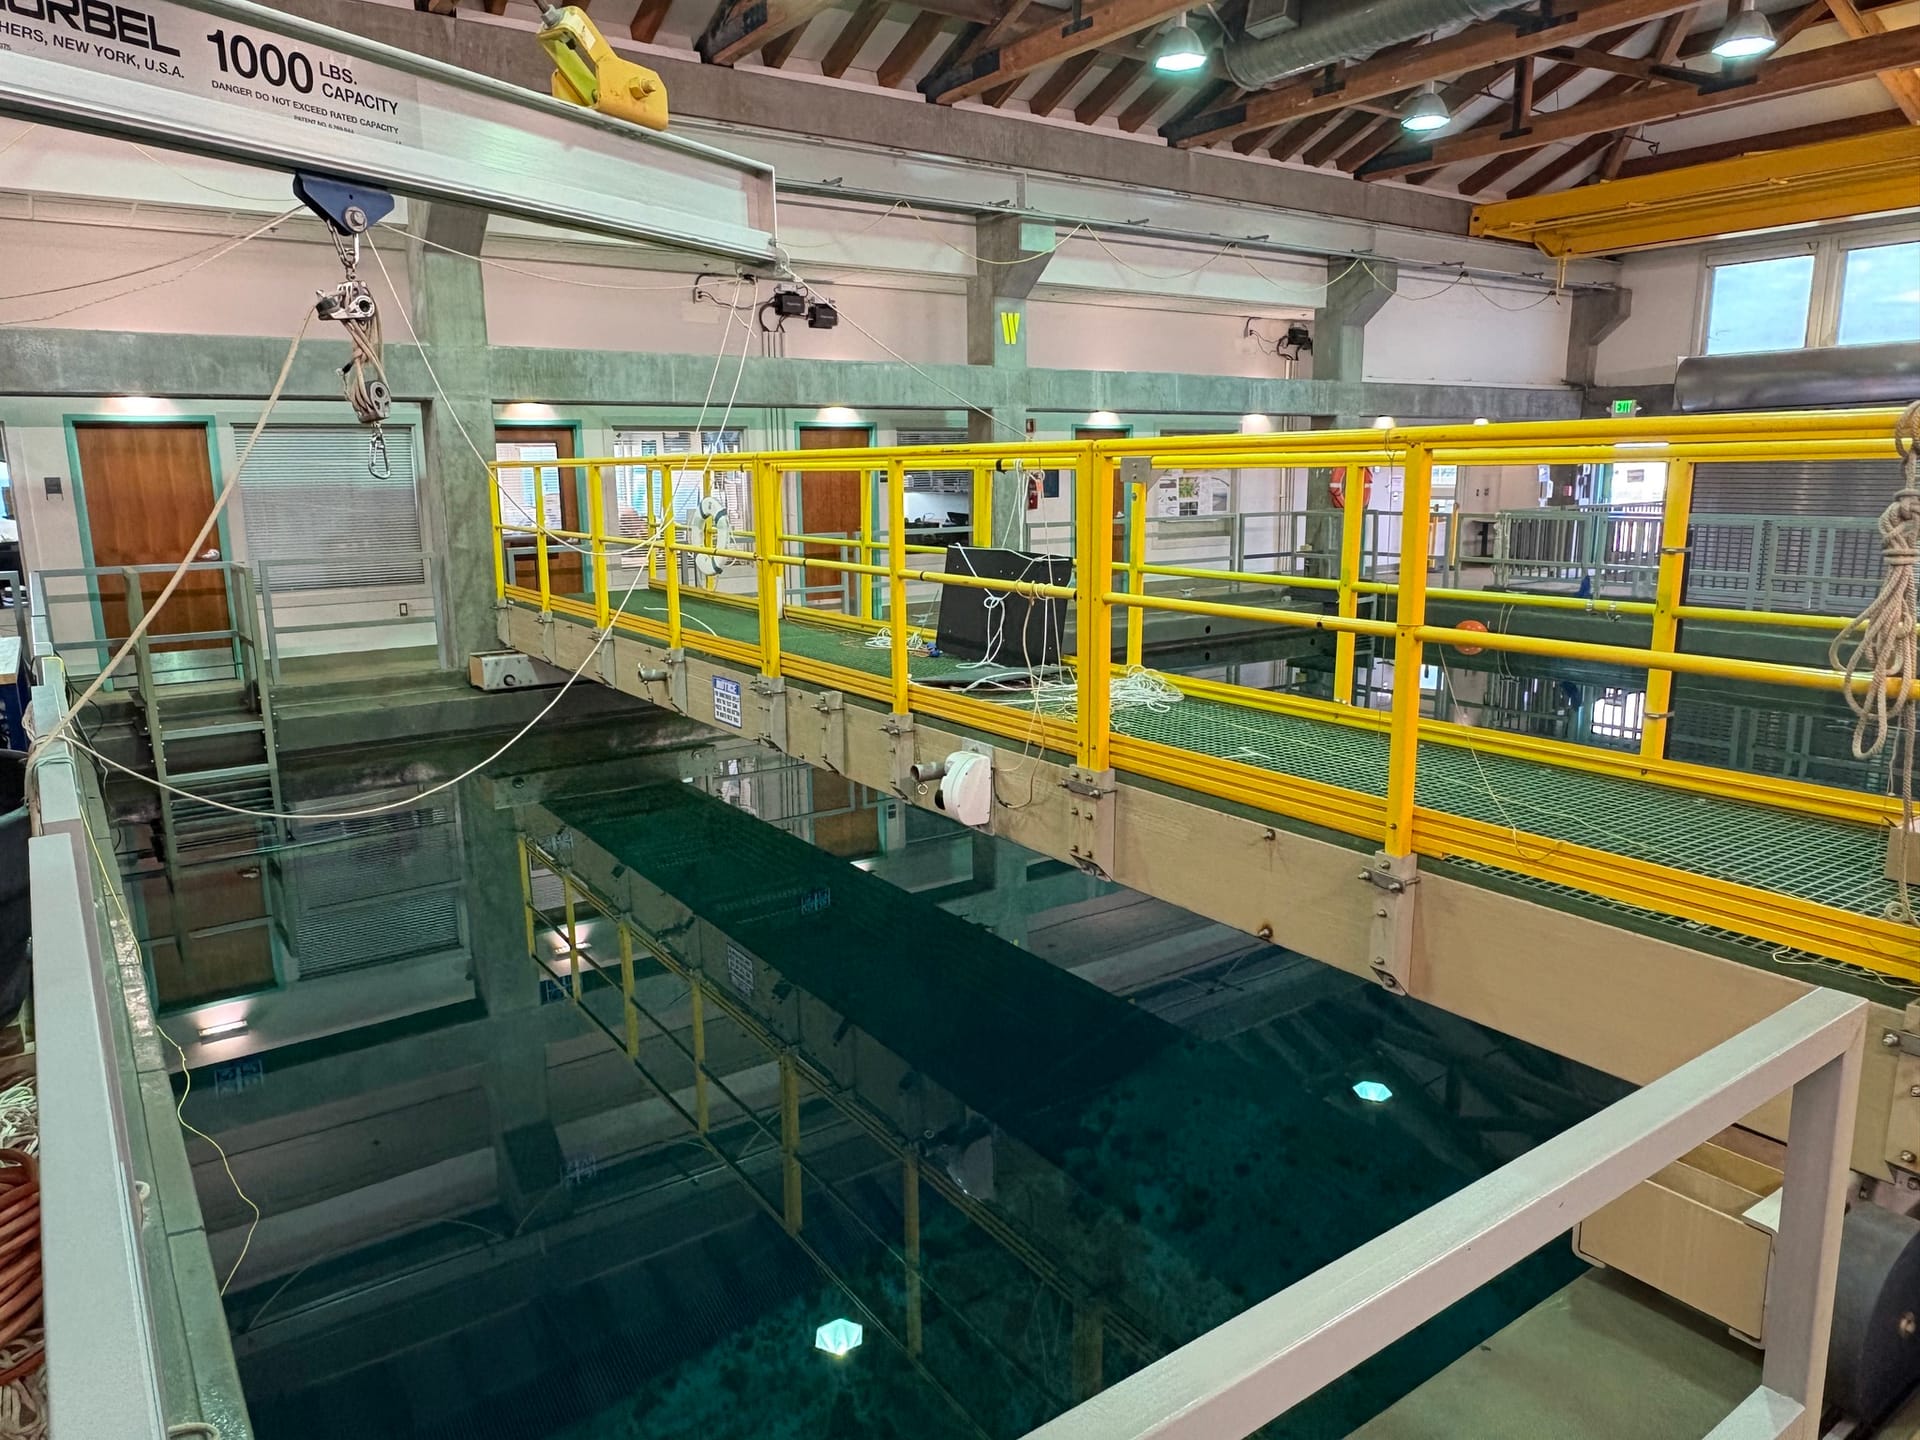
That is an engineering test basin, not a farm. Clear water, fixed lighting, a walkway you can bolt a sensor to. Almost every vision result I have admired was produced somewhere closer to this than to a raceway in February.
Health Is Scored by a Person Holding a Fish
Welfare is not sensed. It is scored, by hand, by people. The FISHWELL handbook, “Welfare Indicators for farmed Atlantic salmon,” is a 351-page manual built on a 0-3 morphological scoring scheme, since updated and replaced by LAKSVEL. Its indicators include opercular damage, jaw deformity, emaciation, vertebral deformity, scale loss, and healed versus active fin damage.
That is a well-specified, image-based, human-scored ontology, and computer vision can inherit it, because someone already did the definitional work of saying what each score means. It is why our annotation schema looks the way it does: nine body-part classes and fifteen anatomical keypoints, chosen because the indicators are anatomical.
Inheriting the ontology is not the same as satisfying it. On our own validation images, our fin scoring maps onto FISHWELL 0-3 and Hoyle 0-5, reads intact fins at roughly 1% missing area and detects injected fraying at roughly 17%. Those are our numbers on our own data, not field accuracy, and the limitation we publish beside them is the honest part: uniform, smooth fin shortening is still hard to detect from one silhouette. A chewed fin is easy. A fin worn down evenly just looks like a smaller fin.
The scoreboard for this layer is Norwegian sea-phase salmon mortality, which the Norwegian Veterinary Institute’s Fish Health Report put at 16.7% in 2023 and 15.4% in 2024. It is the most honest number this industry publishes, and it is still measured after the fact.
The Hatchery Is Where Measurement Has the Most Leverage
Average genetic gain across aquaculture breeding programs runs 13.3% per generation, higher than livestock breeding achieves, and yet the Global Seafood Alliance’s review of selective breeding judges it reasonable to assume less than 10% of today’s production comes from genetically improved animals. That source blames capital, conventional practice and farmer skepticism rather than measurement, and naming that is more useful than pretending it agrees with me.
It is still the layer we picked, and not by accident. It is the one place in the stack where the fish is already out of the water and in somebody’s hands.
What All of This Is Actually For
Stack the layers up and the goal stops being “automate the farm” and becomes something more specific: build a digital twin of it.
A digital twin is a live model of a physical facility, accurate enough that you can interrogate the model instead of the water. Every layer above contributes state to it (water chemistry, oxygen headroom, feed delivered, biomass standing, health scores, the individual animals in each tank), and the value is not any single reading. It is that the readings are in one place, on one clock, attached to the same animals over time.
That is what turns a farm from a thing you react to into a thing you can run experiments on. You can ask what a feed change did to conversion three weeks later. You can ask which family line actually outgrew the others rather than which one the grader remembered. You can ask whether a mortality event started upstream in the biofilter forty hours before anyone saw a dead fish.
None of that requires a robot. It requires the farm to be legible.
And legibility is where the food comes from. Global seafood supply now grows only if farming grows, the population keeps climbing, and the water does not. Every percentage point recovered from wasted feed, every fish that never should have been grown out, every generation of genetic gain that lands a season earlier: that is protein produced from inputs already being spent. A farm you can measure is a farm you can improve, and improvement at this scale is measured in millions of tonnes.
Automate the Layer Under You First
Everything already automated on a farm shares one property: the quantity is directly observable by an instrument that already exists. Oxygen and CO2 control loops, feed delivery, net inspection, biomass frames, camera-based lice counting, mechanical grading. None of those needed a new theory. They needed a sensor that could survive the building.
Everything still waiting is waiting on an instrument nobody trusts yet. Real-time nitrogen species, hydrogen sulfide prevention rather than detection, off-flavor sensing, disease diagnosis beyond gross scoring, welfare scoring, individual-fish phenotyping at population scale. Those are not blocked on models.
The rule falls out of the stack rather than out of taste. Automate a control layer before the sensing layer beneath it is trustworthy and you have built a fast way to be confidently wrong.
Feeding is the honest exception. Feed delivery itself is automated (central feeding barges and distribution systems are standard), but the decision of how much to feed still leans heavily on operator observation rather than on a biomass number. The industry got a working control layer without solving biomass, which is a real counterexample to the tidy version of my argument. What that loop cannot tell you is what the feed bought, because that answer is an FCR.
What the Diagram Leaves Out
The stack is a diagram, and diagrams are tidier than the thing they describe. Every layer in it is somebody’s job, and on any given morning the crew is worried about exactly one of them.
The first time I stood over a raceway in Idaho I had come to talk about cameras. The conversation was about water: how much of it, how fast, and what was in it when it left. That is the automation problem, several layers below where I had planned to start.
I have gotten more useful engineering out of asking which layer somebody is worried about that morning than out of any roadmap I have written. The diagram tells me what depends on what. It does not tell me what hurts.
Only the people standing in the water can tell me that, and so far they always have.